← RushX Academy
Beginner Technical Analysis Guide

Technical Analysisfor Beginners

Learn how to read trends, market structure, support, resistance, candlesticks, volume, indicators, chart patterns, and risk before placing a perpetual-futures trade.

Beginner friendlyMarket structureIndicatorsRisk management

Technical analysis studies price behavior to identify patterns, structure, momentum, and potential reaction zones.

It does not provide certainty. Its value comes from creating objective scenarios, defining invalidation, and controlling risk.

Price
Shows the market's current result
Structure
Shows who controls the market
Volume
Shows participation behind the move
Risk
Defines what happens when the idea fails
01 · Foundation

What Is Technical Analysis?

Technical analysis is the study of historical and current price behavior to estimate possible future scenarios.

Unlike fundamental analysis, it focuses mainly on price action, market structure, volume, volatility, and recurring patterns.

Professional traders do not ask whether price will definitely rise or fall. They ask whether the current setup offers a favorable probability with acceptable risk.

Professional mindset
The goal is not perfect prediction. The goal is repeatable decision-making with predefined invalidation.
02 · Market behavior

Why Technical Analysis Can Be Useful

Markets reflect the combined decisions of institutions, algorithms, market makers, and individual traders.

Fear can accelerate declines, greed can extend rallies, uncertainty can create ranges, and confidence can strengthen trends.

Because crowd behavior often repeats, similar structures can produce similar reactions. The reaction is never guaranteed.

03 · Core ideas

The Three Foundations of Technical Analysis

Price discounts information

Known information and expectations are reflected through buying and selling.

Markets move in trends

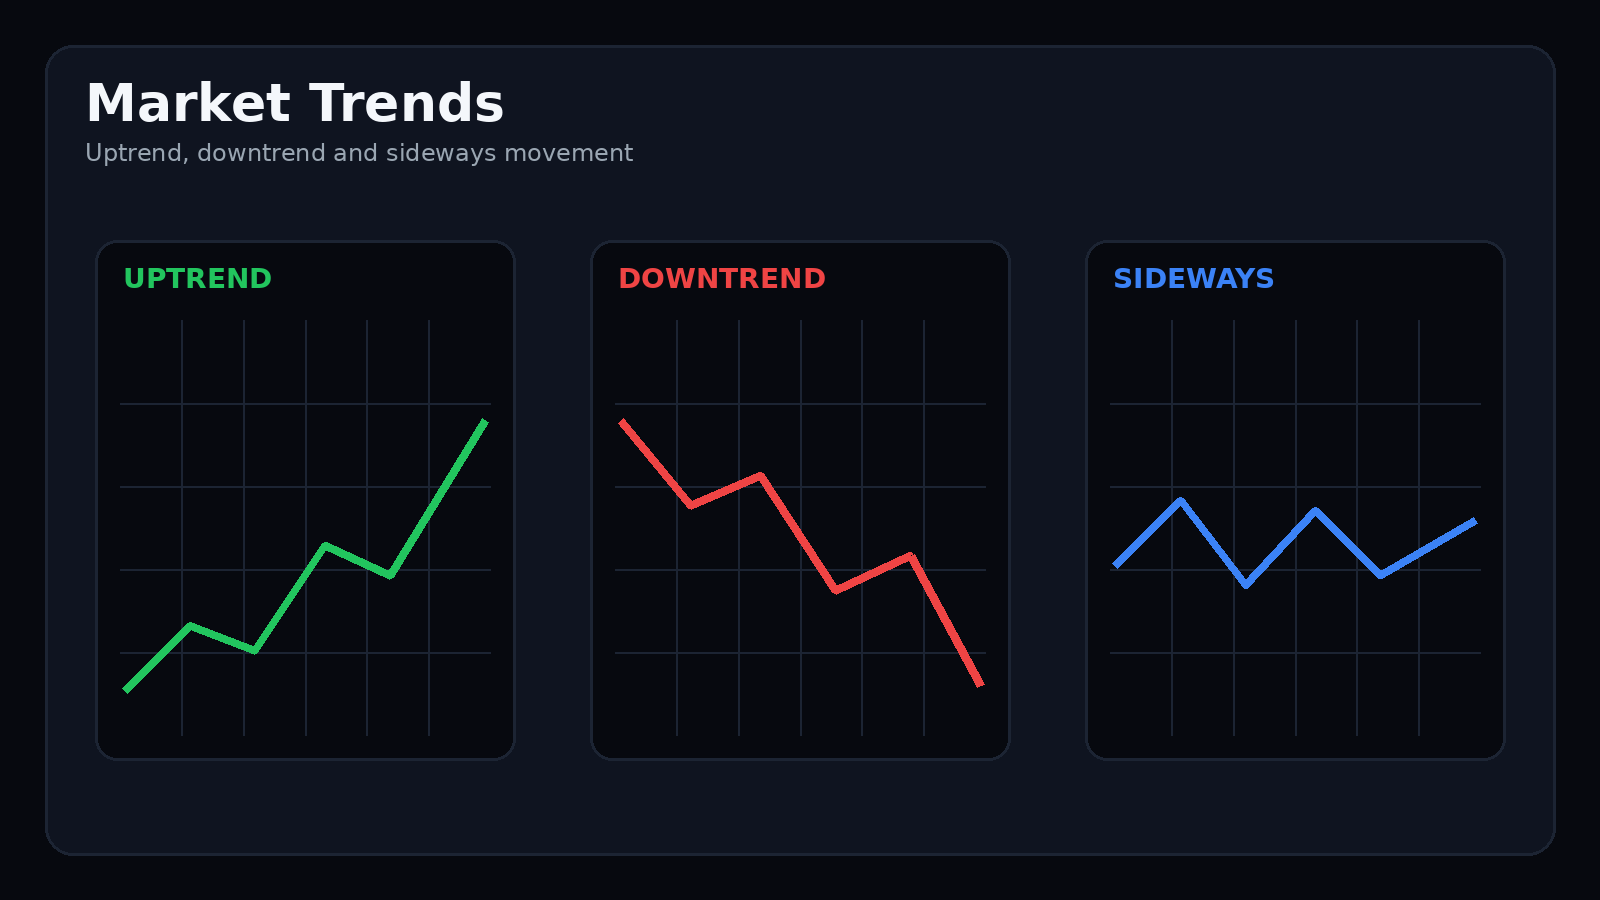
Price often forms directional sequences rather than moving randomly.

Behavior repeats

Similar emotional conditions can create recognizable patterns.

05 · Structure

How to Read Market Structure

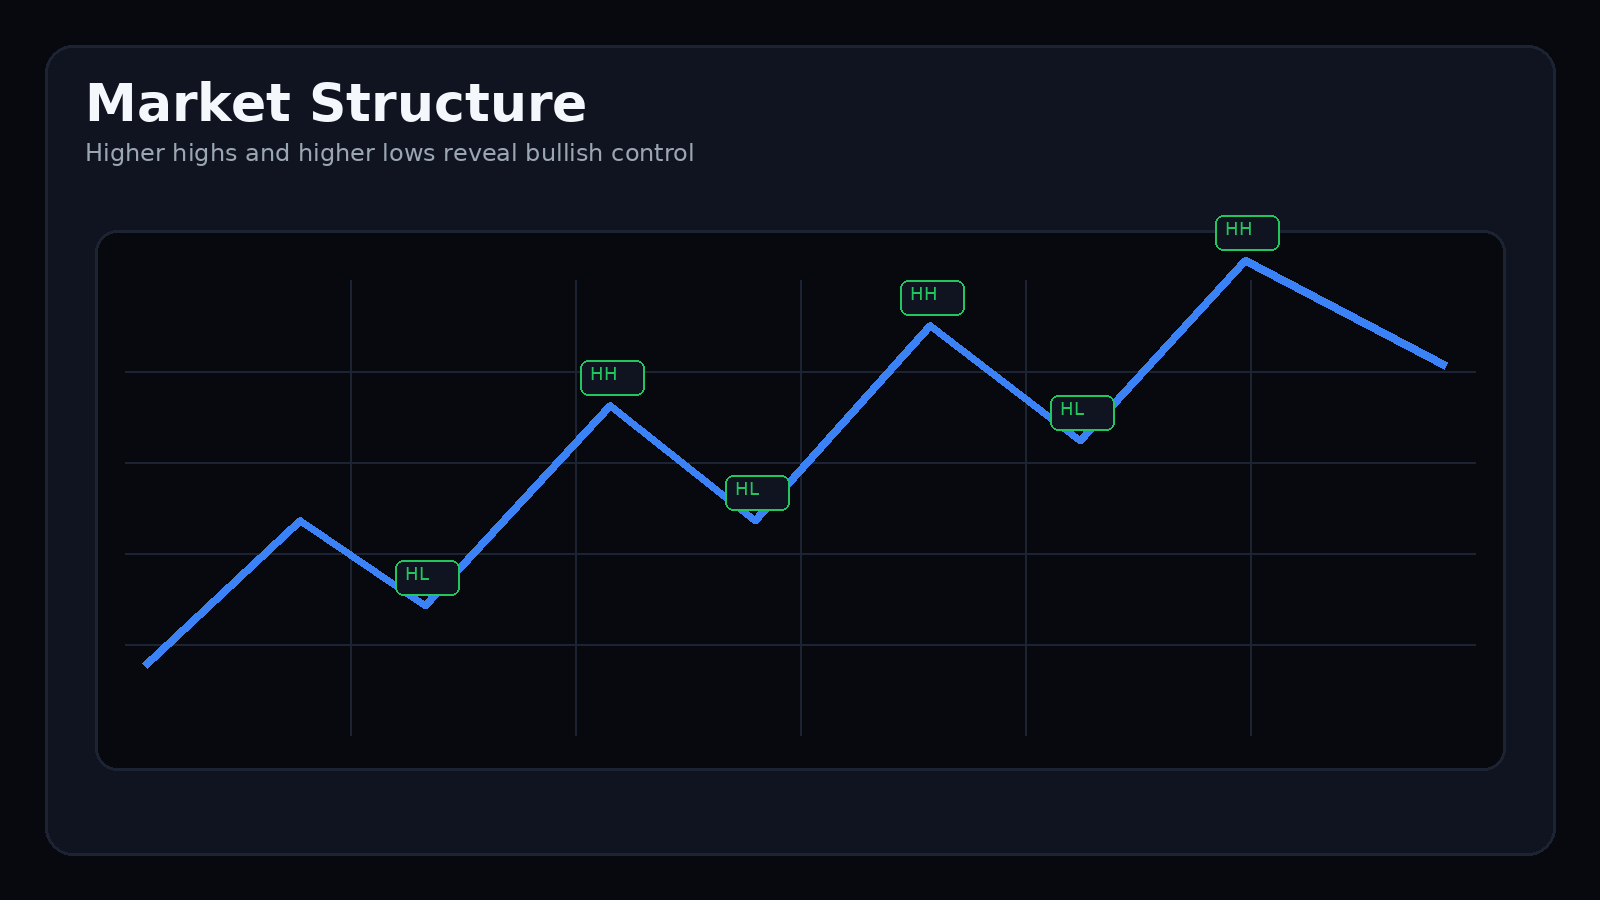
Bullish market structure with higher highs and higher lows
Bullish structure consists of higher highs and higher lows. Bearish structure consists of lower highs and lower lows.
ElementMeaningTypical interpretation
Higher highPrice exceeds the prior swing highBullish continuation
Higher lowPullback holds above the prior swing lowBuyers defend structure
Lower highRecovery fails below the prior swing highSellers remain active
Lower lowPrice breaks the prior swing lowBearish continuation
06 · Key levels

Support and Resistance

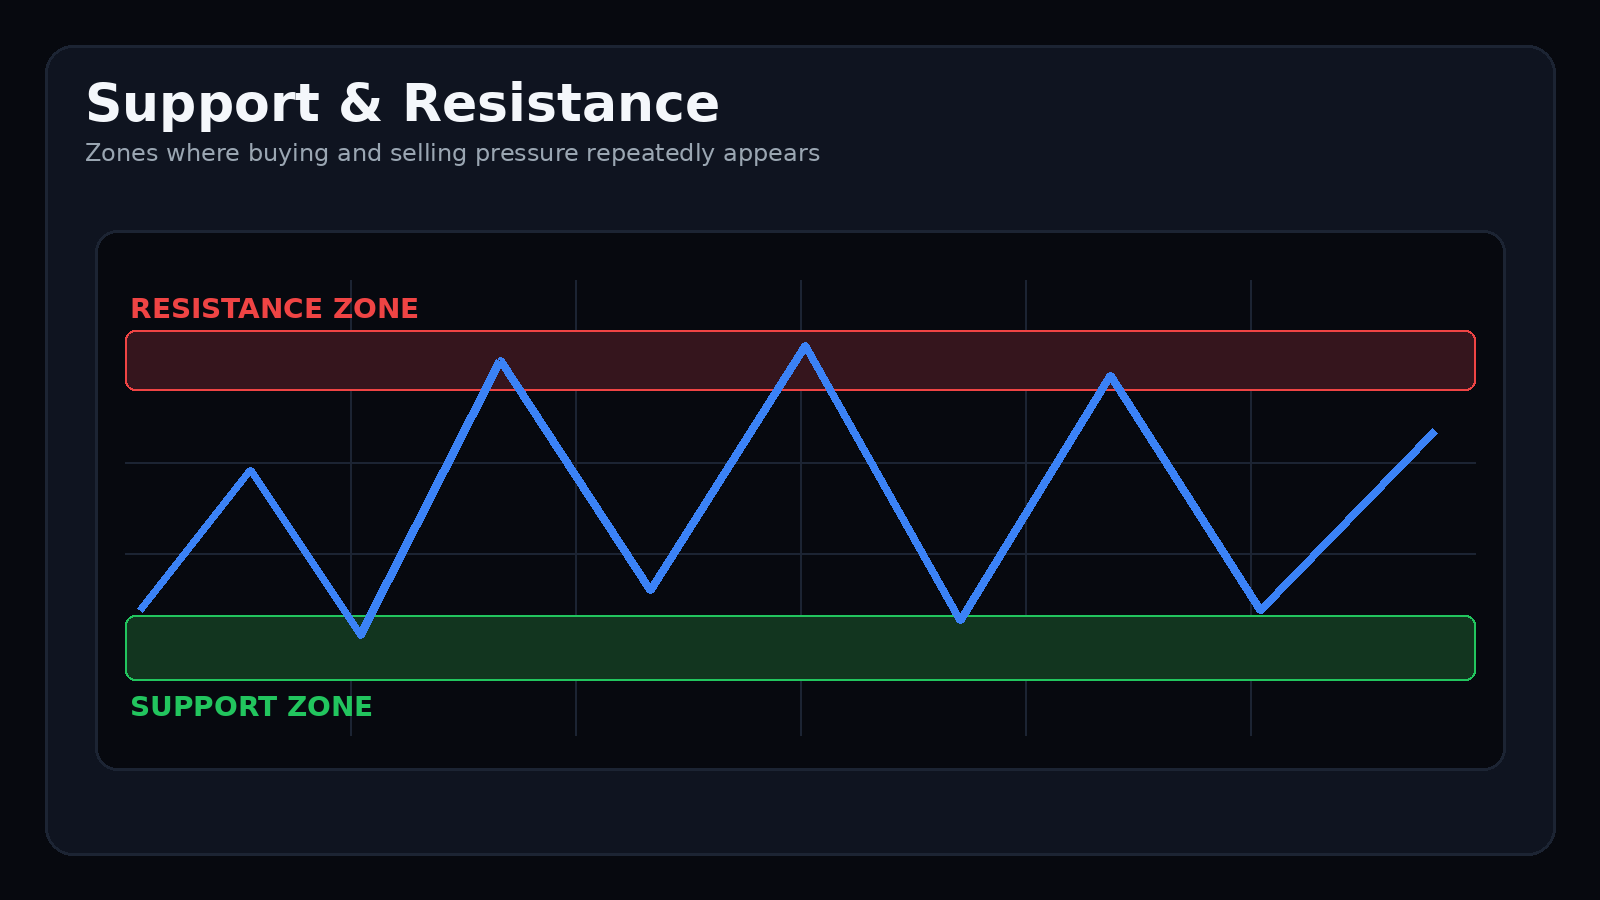
Support and resistance zones
Support represents an area of buying interest. Resistance represents an area of selling interest.

Support

An area where buying previously slowed or reversed a decline.

Resistance

An area where selling previously slowed or reversed an advance.

Use zones, not perfect lines
Real markets rarely react at one exact price. Highlight the area that contains the strongest repeated reactions.
07 · Level breaks

Breakouts, Retests, and Fakeouts

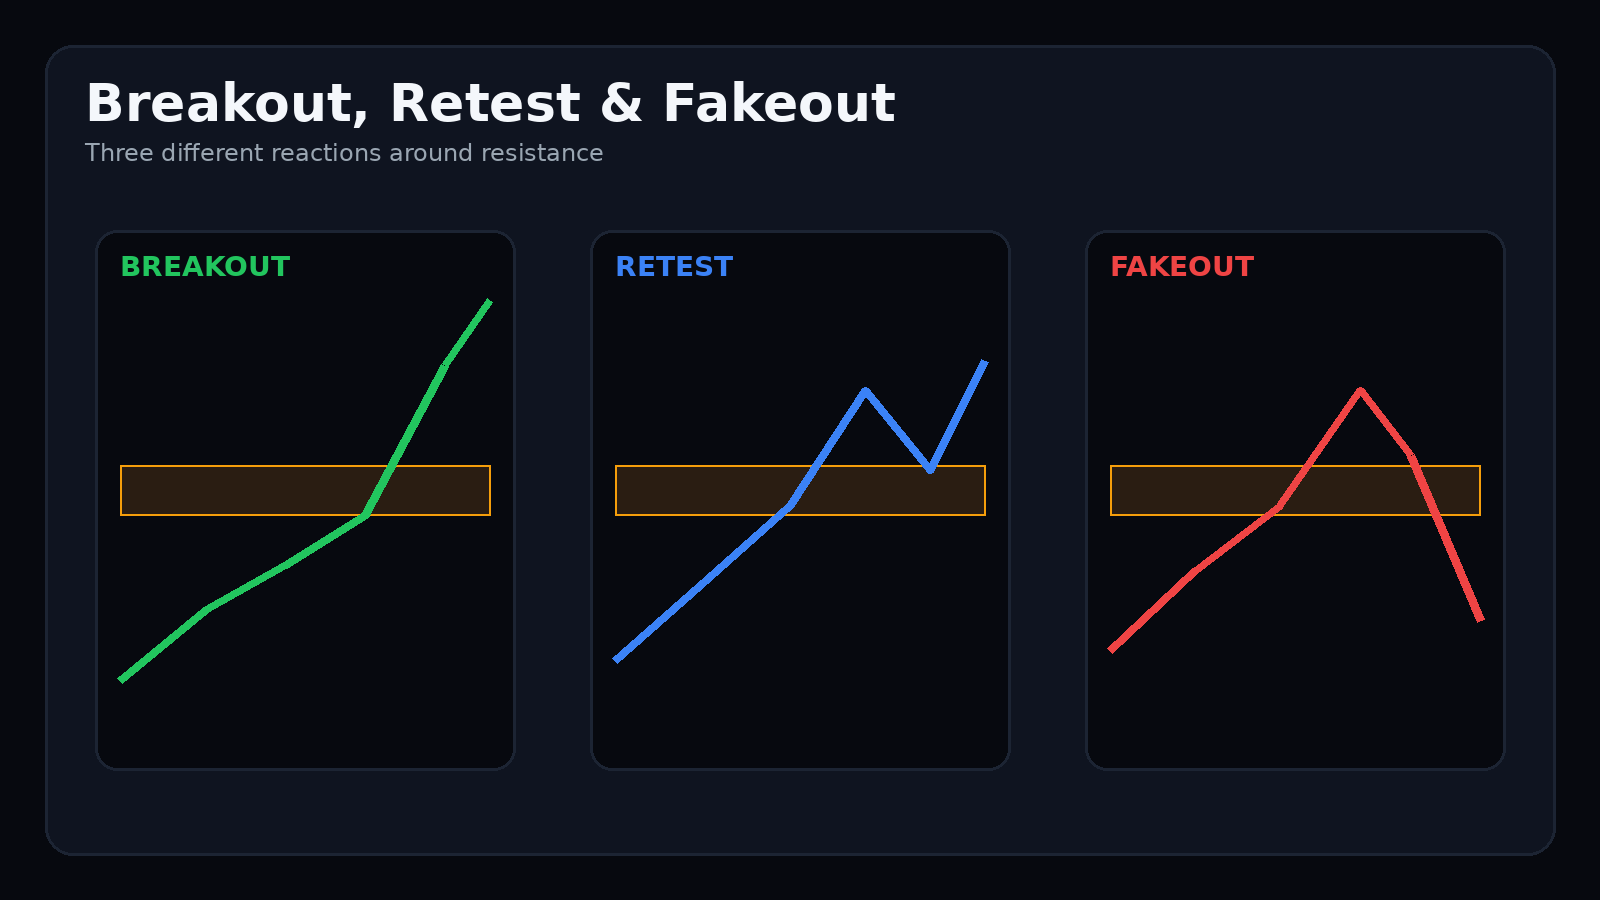
Breakout, retest, and fake breakout
A breakout moves beyond a level, a retest checks acceptance, and a fakeout quickly returns inside the prior range.

Breakout

Price moves beyond established support or resistance.

Retest

Price returns to the broken area to test whether it now acts as the opposite side.

Fakeout

Price briefly breaks the level but fails to remain outside the prior range.

Wait for acceptance
A wick beyond a level is weaker evidence than a decisive close, volume confirmation, and successful retest.
08 · Structural change

Break of Structure and Change of Character

Break of structure

Price breaks an important swing in the direction of the prevailing move or confirms continuation.

Change of character

Price breaks meaningful structure against the current trend, warning that control may be shifting.

One break is not certainty
Confirm structural change with momentum, volume, higher-timeframe context, and nearby support or resistance.
09 · Context

Multi-Timeframe Analysis

Daily chart
Identify the broad trend and major structural levels.
Four-hour chart
Define swing structure and important zones.
One-hour chart
Observe developing setups and confirmations.
Lower timeframe
Refine entry only after higher-timeframe context is clear.
Simple beginner framework
Use one higher timeframe for direction and one lower timeframe for execution.
10 · Candles

Understanding Candlestick Anatomy

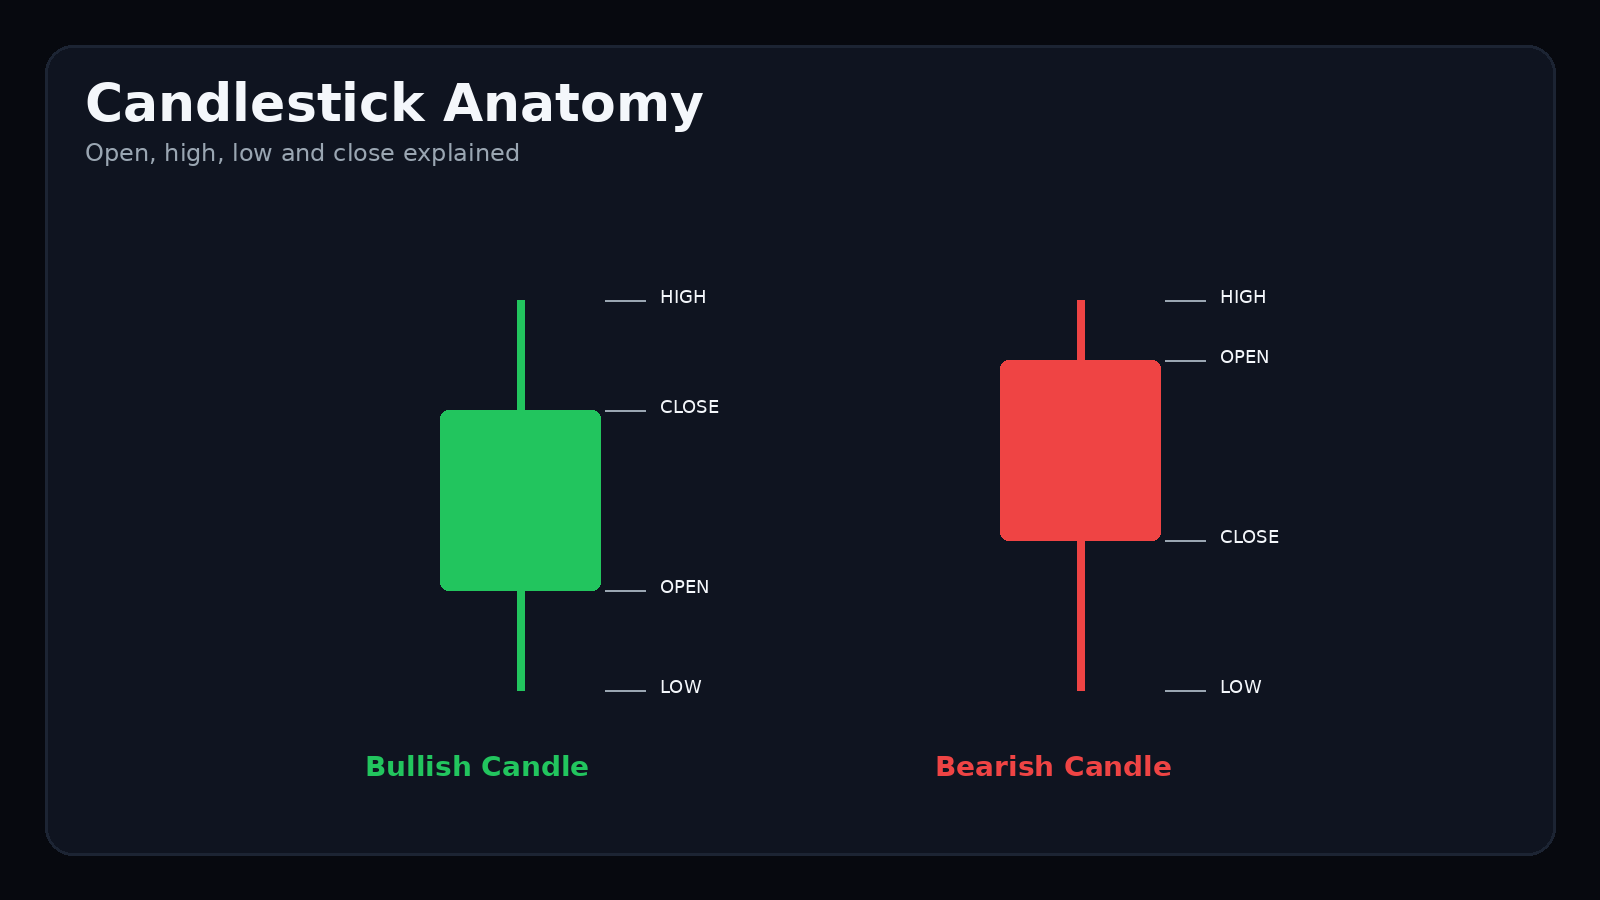
Bullish and bearish candlestick anatomy
Every candlestick contains an open, high, low, and close for the selected period.
Body
The distance between open and close.
Upper wick
The highest price reached above the body.
Lower wick
The lowest price reached below the body.
Close location
Shows where the period ended relative to its range.
Never read one candle alone
Candles become meaningful only when combined with trend, structure, volume, and nearby levels.
11 · Price behavior

Reading Price Action

Price actionPossible meaning
Strong bullish candleBuyers dominated the period
Strong bearish candleSellers dominated the period
Long upper wickHigher prices were rejected
Long lower wickLower prices were rejected
Small bodyIndecision or reduced momentum
Expanding rangeVolatility and participation may be increasing
12 · Participation

Volume Analysis

Volume measures trading activity during a period. It can help determine whether a move has meaningful participation.

Rising price with expanding volume often shows stronger participation than rising price with declining volume.

Breakout + high volume
The move has stronger participation.
Breakout + low volume
The move may be vulnerable to failure.
Price rises + volume falls
Momentum may be weakening.
Selloff + volume spike
Capitulation or liquidation may be occurring.
13 · Indicator

Exponential Moving Averages

EMACommon use
EMA 9Short-term momentum
EMA 20Short swing trend
EMA 50Medium-term direction
EMA 200Long-term trend context
EMA is not an automatic entry
Confirm with structure, momentum, volume, and price action.
14 · Momentum

Relative Strength Index

Above 70

Traditionally called overbought, but strong trends can remain elevated.

Below 30

Traditionally called oversold, but weak markets can remain depressed.

Around 50

Often used as a rough balance between bullish and bearish momentum.

Overbought does not mean sell
RSI describes momentum conditions, not a guaranteed reversal.
15 · Momentum and trend

MACD

MACD line
The difference between two moving averages.
Signal line
A moving average of the MACD line.
Histogram
Shows the distance between MACD and signal.
Crossovers
Can indicate momentum changes but often lag price.
16 · Repeating structures

Common Chart Patterns

Double top
Two failed attempts near resistance may warn of weakening buyers.
Double bottom
Two defended lows may warn that selling pressure is weakening.
Head and shoulders
A possible transition from bullish to bearish structure.
Inverse head and shoulders
A possible transition from bearish to bullish structure.
Triangle
Compression that may resolve with a directional breakout.
Flag
A short consolidation after a strong directional move.
Range
Repeated movement between support and resistance.
Wedge
Narrowing structure that may signal exhaustion or breakout.
Patterns require context
A pattern without volume, structure, and invalidation is only a shape.
17 · Confirmation

Building Confluence

Trend alignment
The setup agrees with the higher-timeframe direction.
Key level
Entry occurs near meaningful support or resistance.
Structure
Swing behavior confirms buyer or seller control.
Volume
Participation supports the expected move.
Momentum
RSI, MACD, or candle strength does not contradict the setup.
Order flow
Visible liquidity and executed flow support the idea.
More indicators are not more confluence
Confluence means independent evidence agrees. Five similar momentum indicators may only repeat the same information.
18 · Capital protection

Technical Analysis Requires Risk Management

Define invalidation
Know where the setup is wrong before entry.
Place the stop
Use technical structure rather than emotion.
Calculate position size
Limit the monetary loss to the chosen account risk.
Set a realistic target
Use structure and risk-reward.
Check leverage
Ensure liquidation is safely beyond the stop.
Accept uncertainty
A valid setup can still fail.
Analysis without risk control is incomplete
A correct market idea can still damage the account when leverage and position size are excessive.
19 · RushX workflow

Using Technical Analysis with RushX

Chart
Identify trend, structure, support, resistance, and invalidation.
Trade Coach
Review timeframe-aware setup quality, reasons, and next trigger.
Guard
Check the stabilized BUY, SELL, WAIT, or NO TRADE decision.
OrderBook+
Inspect bids, asks, spread, depth, liquidity, and executed flow.
Market Intelligence
Compare short-term conditions with broader market context.
Bitcoin Model
For Bitcoin, add long-term cycle and structural context.
Stop and target lines
Keep the full risk plan visible on the chart.
Trading panel
Choose order type, leverage, stop, target, and size deliberately.
Decision support, not certainty
RushX tools organize live information. The trader remains responsible for the final decision and risk.
20 · Errors

Common Beginner Mistakes

Using too many indicators
Creates conflicting signals and chart clutter.
Trading every level
Not every support or resistance zone is important.
Ignoring the higher timeframe
A small move may conflict with the broader trend.
Entering before confirmation
The setup may not yet be accepted by the market.
Treating RSI as automatic
Overbought and oversold conditions can persist.
Chasing breakouts
Late entries often create poor risk-reward.
No stop loss
The downside remains undefined.
Oversizing
A normal loss becomes an account-level problem.
Changing the plan mid-trade
Emotion replaces tested rules.
Believing one signal guarantees success
All technical evidence is probabilistic.
21 · Checklist

Professional Technical Analysis Checklist

Higher-timeframe trend
Is the broader market rising, falling, or ranging?
Market structure
Who currently controls the swings?
Key zones
Where are the strongest support and resistance areas?
Volume
Does participation confirm the move?
Momentum
Is price accelerating or weakening?
Breakout quality
Did price close and hold beyond the level?
Order flow
Do liquidity and executed trades support the idea?
Invalidation
Which level proves the thesis wrong?
Target
Which realistic structure supports the reward?
Position size
How much exposure keeps account risk controlled?
Leverage
Is liquidation safely beyond the stop?
No-trade condition
What makes waiting the better choice?
22 · Glossary

Technical Analysis Terms

Trend
The broad directional behavior of price.
Market structure
The sequence of swing highs and swing lows.
Support
An area where buying may respond.
Resistance
An area where selling may respond.
Breakout
A move beyond an established level.
Retest
A return to a recently broken level.
Fakeout
A failed breakout that returns into the range.
Volume
Trading activity during a period.
Momentum
The strength and speed of price movement.
EMA
An exponential moving average weighted toward recent prices.
RSI
A momentum oscillator between 0 and 100.
MACD
A trend and momentum indicator based on moving averages.
23 · FAQ

Frequently Asked Questions

Does technical analysis predict the future?

No. Technical analysis helps traders organize probabilities, define invalidation, and compare potential reward with risk. It cannot guarantee the next move.

What should a beginner learn first?

Start with trend, market structure, support, resistance, candlesticks, volume, and risk management before adding many indicators.

Which timeframe is best for beginners?

A higher timeframe such as the four-hour or daily chart is often easier to read because it contains less short-term noise. A lower timeframe can then be used for entry refinement.

How many indicators should I use?

Use only a small number that serve different purposes. Too many indicators often repeat the same information and create confusion.

Is RSI above 70 always a sell signal?

No. Strong trends can remain overbought for extended periods. RSI should be interpreted with trend, structure, and price action.

Is RSI below 30 always a buy signal?

No. A weak market can remain oversold while price continues falling. Oversold conditions are not automatic entries.

What is the difference between support and resistance?

Support is an area where buying previously slowed a decline. Resistance is an area where selling previously slowed an advance.

What is a fake breakout?

A fake breakout occurs when price moves beyond a visible level but quickly returns inside the previous range.

What is a retest?

A retest is the return to a recently broken level. Traders use it to evaluate whether the breakout is being accepted.

What is a break of structure?

A break of structure occurs when price moves beyond an important swing high or swing low in a way that confirms continuation or warns of change.

What is a change of character?

A change of character is an early shift in behavior that may indicate the previous market structure is weakening.

Do chart patterns always work?

No. Patterns are only useful when combined with context, volume, structure, liquidity, and risk management.

Can technical analysis be used for perpetual futures?

Yes, but perpetual futures also require attention to leverage, margin, liquidation, funding, and execution risk.

Can Guard replace technical analysis?

No. Guard is a decision-support tool. Traders should still understand structure, liquidity, risk, and the selected timeframe.

Can the Trade Coach guarantee a profitable trade?

No. It summarizes current conditions and can be invalidated by changing markets.

Conclusion

Start with Structure, Then Add Tools

Beginners improve fastest by learning trend, structure, support, resistance, candlesticks, volume, and risk before depending on indicators.

Technical analysis is most useful when it produces a clear thesis, invalidation level, realistic target, and controlled position size.

Apply the framework

Analyze the chart before risking capital

Combine technical structure with Guard, Trade Coach, OrderBook+, Market Intelligence, visible risk levels, and the Bitcoin Model.

Technical analysis does not guarantee future performance. Perpetual futures and leveraged trading involve substantial risk.

Continue learning

Build the complete trading foundation

VIEW ALL GUIDES →